Minimal setup: install it, import from layerchart, and Mochi bundles it into whichever island imports it. Full component reference at
layerchart.com.
Pure SSR — SVG
LayerChart can render to pure SVG or HTML by omitting Mochi's hydrate directives. That needs two opt-ins: ssr (LayerChart skips server rendering otherwise) and
explicit
width/height to set the dimensions, since nothing resizes the container client side.
SVG is recommended for pure SSR graphs: the <Svg> gets a matching viewBox, so the fixed 600×220 geometry rescales to any column width with
CSS alone.
It's composed from <Chart> primitives rather than the <BarChart> shortcut: that shortcut's marks snippet shadows its own
marks prop, which the Svelte server compiler turns into unbounded recursion once ssr forces a server render.
<BarChart>,
<AreaChart>, <LineChart>, <PieChart>, <ScatterChart>, <ArcChart>) can't be
server-rendered — turning on ssr crashes the whole page. For a no-JavaScript chart, build it from the smaller pieces like this one does.
Theming — light/dark
LayerChart ships its tooltip, axis, and other default styles pre-coloured with CSS light-dark() so they read correctly in both modes out of the box — you lean on
that any time you use a LayerChart component without hand-styling its colours, the tooltip most of all. Bun downlevels light-dark() to a
--buncss-light/--buncss-dark toggle but only defines the pair beside a color-scheme rule in the same stylesheet, which LayerChart doesn't
ship — so define it once on :root in your shell:
Interactive — SVG
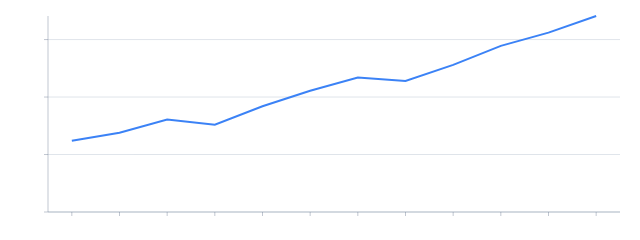
The same library imported from layerchart/svg, hydrated via mochi:hydrate — hover the plot for the crosshair and tooltip. Leaving ssr off
ships an empty frame; omitting
width (which would override the measured container) is what makes it responsive. The tooltip sets portal: false because LayerChart otherwise portals
it to <body>, escaping the themed frame and rendering unstyled.
ssr off, the marks never render on the server, so the all-in-one components like
<AreaChart>
work here — no need to compose from primitives the way the pure-SSR chart does.
Interactive — HTML
Imported from layerchart/html, so the bars are real DOM boxes instead of SVG. This one uses the <BarChart> shortcut — fine here because
ssr is off, so the marks never render on the server. Hydration measures the container, so it reflows fluidly with no viewBox trick needed.
Donut — SVG
A PieChart with a negative innerRadius and cRange colours; click a legend swatch to toggle a slice. Client-only is usually the better fit for
a chart: since LayerChart draws nothing server-side anyway, hydrating would server-render an empty container and reconcile it, whereas a client-only island skips the server pass
entirely and lets you ship real fallback markup — the skeleton below, wiped the moment the component mounts.
Server-rendered image chart
You can server-render charts as an image (JPEG/PNG) using layerchart/server. This is possible today in Mochi but requires a bit of glue code code, see
serverChart.ts in the tab view at the bottom of the demo for an example. The general recommendation if you want to go SSR-only is to use the SVG approach in the first
example.