SSR framework for Svelte 5 + Bun with islands-based selective hydration
On this page
Debug bar
A floating toolbar pinned to the bottom-right of every page in development. It surfaces hydration cost, request metadata, runtime warnings, and a link to the bundle stats page. Mochi.serve() mounts it whenever development: true, with nothing to wire up.

In production (development: false) the toolbar mount point, its entry script, and the per-request window.__mochi_debug payload are stripped from the HTML. The bar adds zero bytes to production responses. See development mode for the rest of what dev mode turns on.
Buttons
| Button | Opens |
|---|---|
| Status dot | Live-reload connection state — green pulse when connected, red when dropped. |
Request | Matched route pattern, pathname, params, response size, Set-Cookies, headers. |
Info | Mochi / Svelte / Bun versions and a snapshot of the active Mochi.serve() config. |
Islands | Per-island breakdown with mode tag, props size, and a locate-on-page button. |
Warnings | Anything pushed through window.__mochi_warn(msg). Hidden when the queue is empty. |
Bundle Stats ↗ | Opens the bundle stats page (/_mochi/client/stats) in a new tab. |
Cache | Empty the on-disk image cache in one click. |
⚙ | Configure which panel buttons appear in the bar. |
Configuring panels
The cogwheel opens a checklist of the panels. Unchecked panels disappear from the bar. The choice persists across reloads in localStorage under mochi:debug:hidden-panels. At least one panel always stays enabled.
Islands panel
Lists every <mochi-hydratable-island> and <mochi-server-island> on the page, grouped by type. Each row shows the component name, its hydration mode, and props size. Click a row to expand the props as syntax-highlighted JSON. Click the crosshair icon to scroll to the island and flash a cyan outline for ~1.5s.
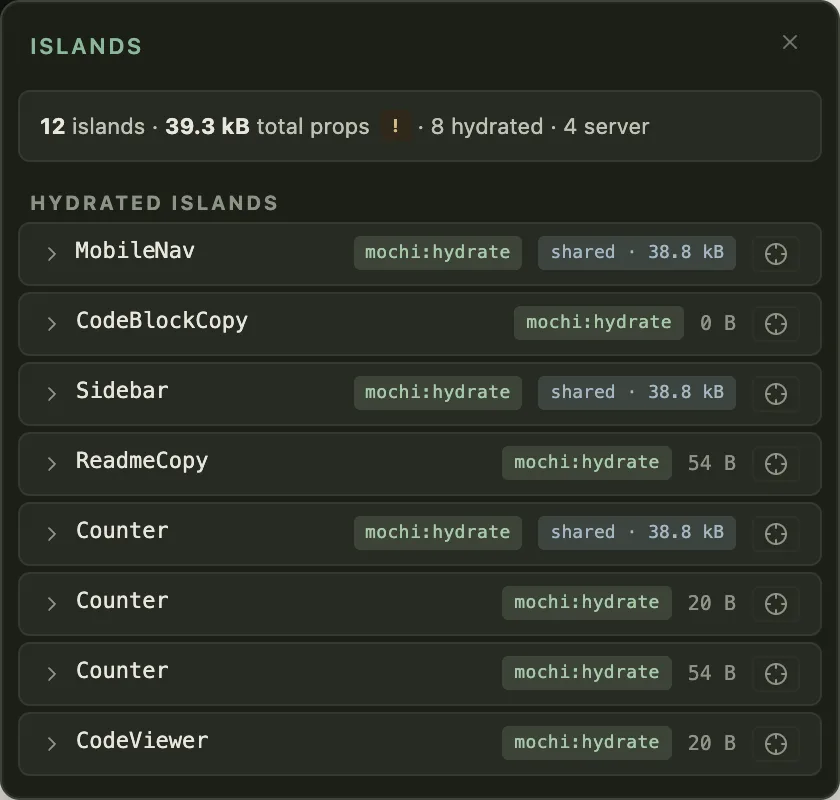
shared badge.The Islands button shows a running total props size and changes color past two thresholds — yellow above 10 KB, red above 100 KB. Props payload is the dominant tax on hydration. See passing props to islands for how to keep payloads small.
When two or more islands ship the exact same props payload, Mochi hoists it into a single shared <script type="application/json"> block. Those rows show a shared badge, and the totals count the shared payload once.
Server islands
Server-island rows display a lock icon. Their props are encrypted before they reach the client. The decoded JSON shown in the panel comes from a dev-only sidecar copy. In production no plaintext props leave the server.
Images panel
Lists every image produced during the request. Deferred URLs from <Image> / getImageUrl show a lock icon and the size-name tag. Inline getImage results show an inline tag. Click a row to expand the preview and params.
Cache panel
An Empty image cache button that clears the on-disk image cache by POSTing to the dev-only /_mochi/image-cache/ endpoint. Useful after tweaking resize settings or replacing a source image. The endpoint and tab exist only while the debug bar is enabled.
Warnings
Any code can queue a warning into the toolbar by calling window.__mochi_warn('message'). Mochi uses this internally for soft hydration issues that are not severe enough to throw. Unread warnings also appear in the page console.
Info panel
Shows the running Mochi, Svelte, and Bun versions, plus a snapshot of the resolved Mochi.serve() config — mode, port, trailing-slash policy, log level, route count, and whether warmup, live-reload, CSRF, proxy, and middleware are active. Captured once at startup.
Panel errors
Each panel renders from live runtime state, so the panels are wrapped in an error boundary: a render fault in one degrades that panel instead of throwing onto the host page, and the toolbar stays usable. The fault is still logged to the console as [mochi] debug-bar panel render fault: ….
The bar ships as a production-Svelte bundle, so that log carries no detail. To debug a panel fault, restart with MOCHI_DEBUGBAR_DIAGNOSTIC=1 — the bar then compiles dev-Svelte and un-minified, so the logged error names the exact cause (and, for a keyed-{#each} collision, the duplicate key) with a readable stack. For temporary debugging only; it makes the bundle larger.