Charts with LayerChart
LayerChart renders to plain HTML or SVG, so it server-renders like any other Svelte component. The first chart ships no JavaScript; the rest are islands.
Minimal setup: install it, import from layerchart, and Mochi bundles it into whichever island imports it. Full component reference at layerchart.com.
bun add layerchartPure SSR — SVG
LayerChart can render to pure SVG or HTML by omitting Mochi's hydrate directives. That needs two opt-ins: ssr (LayerChart skips server rendering otherwise) and
explicit width/height to set the dimensions, since nothing resizes the container client side.
SVG is recommended for pure SSR graphs: the <Svg> gets a matching viewBox, so the fixed 600×220 geometry rescales to any column width with
CSS alone.
It's composed from <Chart> primitives rather than the <BarChart> shortcut: that shortcut's marks snippet shadows its own marks prop, which the Svelte server compiler turns into unbounded recursion once ssr forces a server render.
<script lang="ts">
  import { Chart, Svg, Axis, Bars } from 'layerchart/svg';
  import { traffic } from './data.ts';
</script>

<Chart ssr data={traffic} x="month" y="requests" c="requests" cRange={['var(--chart-1)']} width={600} height={220}>
  <Svg viewBox="0 0 600 220">
    <Axis placement="left" grid rule ticks={4} />
    <Axis placement="bottom" rule />
    <Bars fill="var(--chart-1)" />
  </Svg>
</Chart>Theming — light/dark
LayerChart ships its tooltip, axis, and other default styles pre-coloured with CSS light-dark() so they read correctly in both modes out of the box — you lean on
that any time you use a LayerChart component without hand-styling its colours, the tooltip most of all. Bun downlevels light-dark() to a --buncss-light/--buncss-dark toggle but only defines the pair beside a color-scheme rule in the same stylesheet, which LayerChart doesn't
ship — so define it once on :root in your shell:
/* shell.html — supply the definitions Bun's light-dark() downlevel expects */
:root {
  color-scheme: light dark;
  --buncss-light: initial;
  --buncss-dark: ;
}

/* System preference, unless the user explicitly picked light */
@media (prefers-color-scheme: dark) {
  :root:not([data-theme='light']) {
    --buncss-light: ;
    --buncss-dark: initial;
  }
}

/* Explicit dark choice, regardless of system preference */
:root[data-theme='dark'] {
  --buncss-light: ;
  --buncss-dark: initial;
}
Interactive — SVG
The same library imported from layerchart/svg, hydrated via mochi:hydrate — hover the plot for the crosshair and tooltip. Leaving ssr off
ships an empty frame; omitting width (which would override the measured container) is what makes it responsive. The tooltip sets portal: false because LayerChart otherwise portals
it to <body>, escaping the themed frame and rendering unstyled.
<script lang="ts">
  import { AreaChart } from 'layerchart/svg';
  import { traffic, seriesColors } from './data.ts';

  const series = [
    { key: 'requests', label: 'Requests', color: seriesColors[0] },
    { key: 'cached', label: 'Cache hits', color: seriesColors[2] },
  ];
</script>

<!-- No ssr, no width: hydration measures the container. -->
<AreaChart data={traffic} x="month" {series} height={260} props={{ tooltip: { root: { portal: false } } }} />
Interactive — HTML
Imported from layerchart/html, so the bars are real DOM boxes instead of SVG. This one uses the <BarChart> shortcut — fine here because ssr is off, so the marks never render on the server. Hydration measures the container, so it reflows fluidly with no viewBox trick needed.
<script lang="ts">
  import { BarChart } from 'layerchart/html';
  import { traffic, seriesColors } from './data.ts';

  const series = [
    { key: 'requests', label: 'Requests', color: seriesColors[0] },
    { key: 'cached', label: 'Cache hits', color: seriesColors[2] },
  ];
</script>

<!-- HTML renderer: real DOM boxes; the BarChart shortcut is fine since ssr is off. -->
<BarChart data={traffic} x="month" {series} seriesLayout="group" legend height={260} />
Donut — SVG
A PieChart with a negative innerRadius and cRange colours; click a legend swatch to toggle a slice. Client-only is usually the better fit for
a chart: since LayerChart draws nothing server-side anyway, hydrating would server-render an empty container and reconcile it, whereas a client-only island skips the server pass
entirely and lets you ship real fallback markup — the skeleton below, wiped the moment the component mounts.
Server-rendered image chart
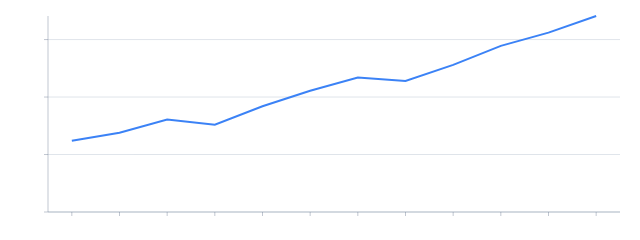
You can server-render charts as an image (JPEG/PNG) using layerchart/server. This is possible today in Mochi but requires a bit of glue code code, see serverChart.ts in the tab view at the bottom of the demo for an example. The general recommendation if you want to go SSR-only is to use the SVG approach in the first
example.
<script lang="ts">
  import { ServerChart } from 'layerchart/server';
  import { Axis, Grid, Spline } from 'layerchart';
  let { data, width, height, capture, onCapture } = $props();
</script>

<ServerChart {capture} {onCapture} {width} {height} {data} x="month" y="requests" yDomain={[0, null]}>
  <Grid y />
  <Axis placement="left" rule ticks={4} format={(v) => v / 1000 + 'k'} />
  <Axis placement="bottom" rule />
  <Spline stroke="rgb(59,130,246)" strokeWidth={2} />
</ServerChart>
// routes.ts — renders the chart to an image buffer on request
'/demos/charts/traffic.png': Mochi.api(async ({ url }) => {
// See implementation of serverChart in the tabs below
const { renderTrafficChart } = await import('./serverChart');
const format = url.searchParams.get('format') === 'jpeg' ? 'jpeg' : 'png';
const image = await renderTrafficChart({ width: 640, height: 240, format });
return new Response(image, { headers: { 'Content-Type': 'image/' + format } });
}),
<script lang="ts">
import CodeSnippet from '../../components/CodeSnippet.svelte';
import StaticTrafficChart from './StaticTrafficChart.svelte';
import TrafficChart from './TrafficChart.svelte';
import HtmlBars from './HtmlBars.svelte';
import RuntimeDonut from './RuntimeDonut.svelte';
import Callout from '../../../../docs/_components/Callout.svelte';
import { highlightCode } from '../../lib/highlight.server';
const install = await highlightCode('bun add layerchart', 'bash');
const themingCss = await highlightCode(
`/* shell.html — supply the definitions Bun's light-dark() downlevel expects */
:root {
color-scheme: light dark;
--buncss-light: initial;
--buncss-dark: ;
}
/* System preference, unless the user explicitly picked light */
@media (prefers-color-scheme: dark) {
:root:not([data-theme='light']) {
--buncss-light: ;
--buncss-dark: initial;
}
}
/* Explicit dark choice, regardless of system preference */
:root[data-theme='dark'] {
--buncss-light: ;
--buncss-dark: initial;
}`,
'css',
);
const staticExample = await highlightCode(
`<script lang="ts">
import { Chart, Svg, Axis, Bars } from 'layerchart/svg';
import { traffic } from './data.ts';
${'<'}/script>
<Chart ssr data={traffic} x="month" y="requests" c="requests" cRange={['var(--chart-1)']} width={600} height={220}>
<Svg viewBox="0 0 600 220">
<Axis placement="left" grid rule ticks={4} />
<Axis placement="bottom" rule />
<Bars fill="var(--chart-1)" />
</Svg>
</Chart>`,
'svelte',
);
const interactiveExample = await highlightCode(
`<script lang="ts">
import { AreaChart } from 'layerchart/svg';
import { traffic, seriesColors } from './data.ts';
const series = [
{ key: 'requests', label: 'Requests', color: seriesColors[0] },
{ key: 'cached', label: 'Cache hits', color: seriesColors[2] },
];
${'<'}/script>
<!-- No ssr, no width: hydration measures the container. -->
<AreaChart data={traffic} x="month" {series} height={260} props={{ tooltip: { root: { portal: false } } }} />`,
'svelte',
);
const htmlExample = await highlightCode(
`<script lang="ts">
import { BarChart } from 'layerchart/html';
import { traffic, seriesColors } from './data.ts';
const series = [
{ key: 'requests', label: 'Requests', color: seriesColors[0] },
{ key: 'cached', label: 'Cache hits', color: seriesColors[2] },
];
${'<'}/script>
<!-- HTML renderer: real DOM boxes; the BarChart shortcut is fine since ssr is off. -->
<BarChart data={traffic} x="month" {series} seriesLayout="group" legend height={260} />`,
'svelte',
);
const serverComponentExample = await highlightCode(
`<script lang="ts">
import { ServerChart } from 'layerchart/server';
import { Axis, Grid, Spline } from 'layerchart';
let { data, width, height, capture, onCapture } = $props();
${'<'}/script>
<ServerChart {capture} {onCapture} {width} {height} {data} x="month" y="requests" yDomain={[0, null]}>
<Grid y />
<Axis placement="left" rule ticks={4} format={(v) => v / 1000 + 'k'} />
<Axis placement="bottom" rule />
<Spline stroke="rgb(59,130,246)" strokeWidth={2} />
</ServerChart>`,
'svelte',
);
const serverRouteExample = await highlightCode(
`// routes.ts — renders the chart to an image buffer on request
'/demos/charts/traffic.png': Mochi.api(async ({ url }) => {
// See implementation of serverChart in the tabs below
const { renderTrafficChart } = await import('./serverChart');
const format = url.searchParams.get('format') === 'jpeg' ? 'jpeg' : 'png';
const image = await renderTrafficChart({ width: 640, height: 240, format });
return new Response(image, { headers: { 'Content-Type': 'image/' + format } });
}),`,
'typescript',
);
</script>
<p>
Minimal setup: install it, import from <code>layerchart</code>, and Mochi bundles it into whichever island imports it. Full component reference at
<a href="https://www.layerchart.com" target="_blank" rel="noopener noreferrer">layerchart.com</a>.
</p>
<CodeSnippet html={install} />
<h2>Pure SSR — SVG</h2>
<p>
LayerChart can render to pure SVG or HTML by omitting Mochi's hydrate directives. That needs two opt-ins: <code>ssr</code> (LayerChart skips server rendering otherwise) and
explicit
<code>width</code>/<code>height</code> to set the dimensions, since nothing resizes the container client side.
</p>
<p>
SVG is recommended for pure SSR graphs: the <code><Svg></code> gets a matching <code>viewBox</code>, so the fixed 600×220 geometry rescales to any column width with
CSS alone.
</p>
<p>
It's composed from <code><Chart></code> primitives rather than the <code><BarChart></code> shortcut: that shortcut's <code>marks</code> snippet shadows its own
<code>marks</code> prop, which the Svelte server compiler turns into unbounded recursion once <code>ssr</code> forces a server render.
</p>
<Callout type="warning">
<strong>LayerChart's SSR pitfall.</strong> LayerChart doesn't officially support SSR for its SVG and HTML renderers, and its all-in-one chart components (<code
><BarChart></code
>,
<code><AreaChart></code>, <code><LineChart></code>, <code><PieChart></code>, <code><ScatterChart></code>, <code><ArcChart></code>) can't be
server-rendered — turning on <code>ssr</code> crashes the whole page. For a no-JavaScript chart, build it from the smaller pieces like this one does.
</Callout>
<CodeSnippet html={staticExample} />
<StaticTrafficChart />
<h2>Theming — light/dark</h2>
<p>
LayerChart ships its tooltip, axis, and other default styles pre-coloured with CSS <code>light-dark()</code> so they read correctly in both modes out of the box — you lean on
that any time you use a LayerChart component without hand-styling its colours, the tooltip most of all. Bun downlevels <code>light-dark()</code> to a
<code>--buncss-light</code>/<code>--buncss-dark</code> toggle but only defines the pair beside a <code>color-scheme</code> rule in the same stylesheet, which LayerChart doesn't
ship — so define it once on <code>:root</code> in your shell:
</p>
<CodeSnippet html={themingCss} />
<h2>Interactive — SVG</h2>
<p>
The same library imported from <code>layerchart/svg</code>, hydrated via <code>mochi:hydrate</code> — hover the plot for the crosshair and tooltip. Leaving <code>ssr</code> off
ships an empty frame; omitting
<code>width</code> (which would override the measured container) is what makes it responsive. The tooltip sets <code>portal: false</code> because LayerChart otherwise portals
it to <code><body></code>, escaping the themed frame and rendering unstyled.
</p>
<Callout type="info">
<strong>Helpers are fine when hydrating.</strong> With <code>ssr</code> off, the marks never render on the server, so the all-in-one components like
<code><AreaChart></code>
work here — no need to compose from primitives the way the pure-SSR chart does.
</Callout>
<CodeSnippet html={interactiveExample} />
<TrafficChart mochi:hydrate />
<h2>Interactive — HTML</h2>
<p>
Imported from <code>layerchart/html</code>, so the bars are real DOM boxes instead of SVG. This one uses the <code><BarChart></code> shortcut — fine here because
<code>ssr</code> is off, so the marks never render on the server. Hydration measures the container, so it reflows fluidly with no <code>viewBox</code> trick needed.
</p>
<CodeSnippet html={htmlExample} />
<HtmlBars mochi:hydrate />
<h2>Donut — SVG</h2>
<p>
A <code>PieChart</code> with a negative <code>innerRadius</code> and <code>cRange</code> colours; click a legend swatch to toggle a slice. Client-only is usually the better fit for
a chart: since LayerChart draws nothing server-side anyway, hydrating would server-render an empty container and reconcile it, whereas a client-only island skips the server pass
entirely and lets you ship real fallback markup — the skeleton below, wiped the moment the component mounts.
</p>
<RuntimeDonut mochi:clientOnly>
<div class="skeleton">Loading chart…</div>
</RuntimeDonut>
<h2>Server-rendered image chart</h2>
<p>
You can server-render charts as an image (JPEG/PNG) using <code>layerchart/server</code>. This is possible today in Mochi but requires a bit of glue code code, see
<code>serverChart.ts</code> in the tab view at the bottom of the demo for an example. The general recommendation if you want to go SSR-only is to use the SVG approach in the first
example.
</p>
<CodeSnippet html={serverComponentExample} />
<CodeSnippet html={serverRouteExample} />
<img class="server-png" src="/demos/charts/traffic.png" alt="Server-rendered traffic chart, January through December" width="640" height="240" />
Styles
<style>
  p {
    margin: 0 0 0.75rem;
    font-size: 0.95rem;
    color: var(--text-muted);
    line-height: 1.55;
  }

  p a {
    color: var(--accent);
    font-weight: 600;
  }

  .skeleton {
    display: flex;
    align-items: center;
    justify-content: center;
    height: 324px;
    border: 1px dashed var(--border-strong);
    border-radius: var(--radius-md);
    background: var(--surface-muted);
    color: var(--text-subtle);
    font-size: 0.9rem;
  }

  .server-png {
    display: block;
    width: 100%;
    max-width: 640px;
    height: auto;
    border: 1px solid var(--border-strong);
    border-radius: var(--radius-md);
    background: #fff;
  }

  code {
    background: var(--code-bg);
    color: var(--code-accent);
    padding: 0.05rem 0.35rem;
    border-radius: var(--radius-sm);
    font-family: var(--font-mono);
    font-size: 0.85rem;
  }
</style>
More demos